AI Proficiency
Dec 9, 2025
Enterprise AI Usage Data: Complete Guide to Measuring Adoption & ROI | Larridin

Jim Larrison
From Larridin


The Complete Guide to Enterprise AI Usage Data and Adoption Analytics
Key Takeaway
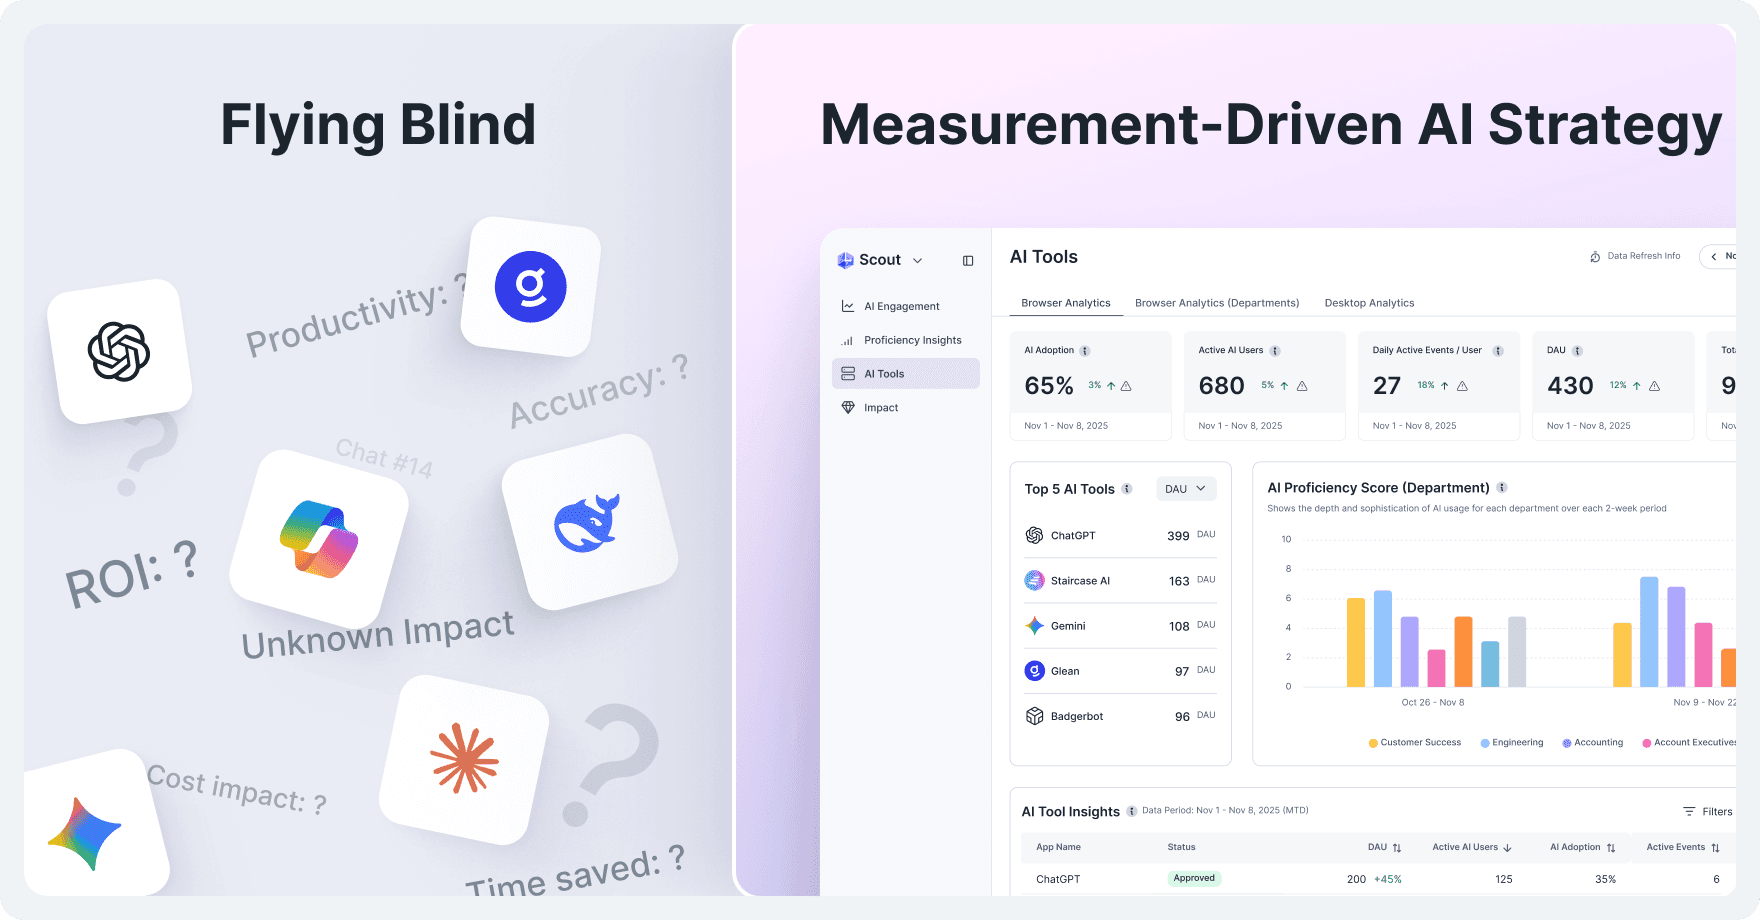
Without AI usage data, organizations make decisions blind: expanding wrong tools, missing adoption barriers, and funding experiments with zero accountability. Enterprise AI spending will reach $644 billion in 2025, yet 69% of technology leaders have lost visibility into their AI infrastructure. Larridin's Utilization × Proficiency × Value framework transforms AI chaos into measurable competitive advantage by revealing who uses AI, how effectively, and what business impact it delivers.
The Complete Guide to Enterprise AI Usage Data and Adoption Analytics
Quick Navigation
Key Terms
AI Usage Data: Detailed information about who accesses AI tools, how frequently, what features they use, and what business outcomes result.
Utilization Metrics: Measurement of AI adoption patterns, including daily active users, session frequency, and tool-specific adoption rates by department.
Proficiency Metrics: Assessment of how effectively employees use AI tools, including advanced feature adoption, prompt sophistication, and workflow integration.
Value Metrics: Connection between AI usage and measurable business outcomes, such as productivity gains, cost efficiency, and ROI.
Shadow AI: Unauthorized AI applications used by employees outside approved systems.
Human+AI Workforce: The collaborative model where AI tools augment human capabilities. It requires both components to be measured for true productivity assessment.
Enterprise AI spending will reach $644 billion in 2025 according to our State of Enterprise AI 2025 report. Yet most CIOs and CFOs can't answer three fundamental questions:
Which teams are actually using AI?
How well are they using it?
What business value does it deliver?
The problem isn't lack of AI investment. Organizations purchase tools, provision licenses, and approve budgets. The issue is lack of usage data. That's like measuring the number of gym memberships instead of whether anyone got stronger.
The gap creates dangerous blind spots. According to the Larridin State of Enterprise AI 2025 report, 69% of technology leaders don’t have visibility into their own AI infrastructure. Without usage data, enterprises are flying blind: expanding the wrong tools, missing adoption barriers, and funding experiments with zero accountability.
This creates the ROI measurement paradox: 78.6% of large enterprises say they effectively measure the results of AI investment, but at the same time, admit they don’t have standardized success metrics or full visibility into their AI infrastructure.
This guide explains what AI usage data actually measures, why license tracking fails executives, and how to build measurement systems that turn AI chaos into competitive advantage.
Why License Tracking Isn't Enough
What License Metrics Show vs. Hide
License tracking captures inputs/seats purchased, contracts signed, and budget allocated. It answers "How much did we spend?" but ignores "What did we get?"
According to the Larridin State of Enterprise AI 2025 report, 84% of organizations discover more AI tools than expected during internal audits. Most find that they're paying for capacity that adds zero value.
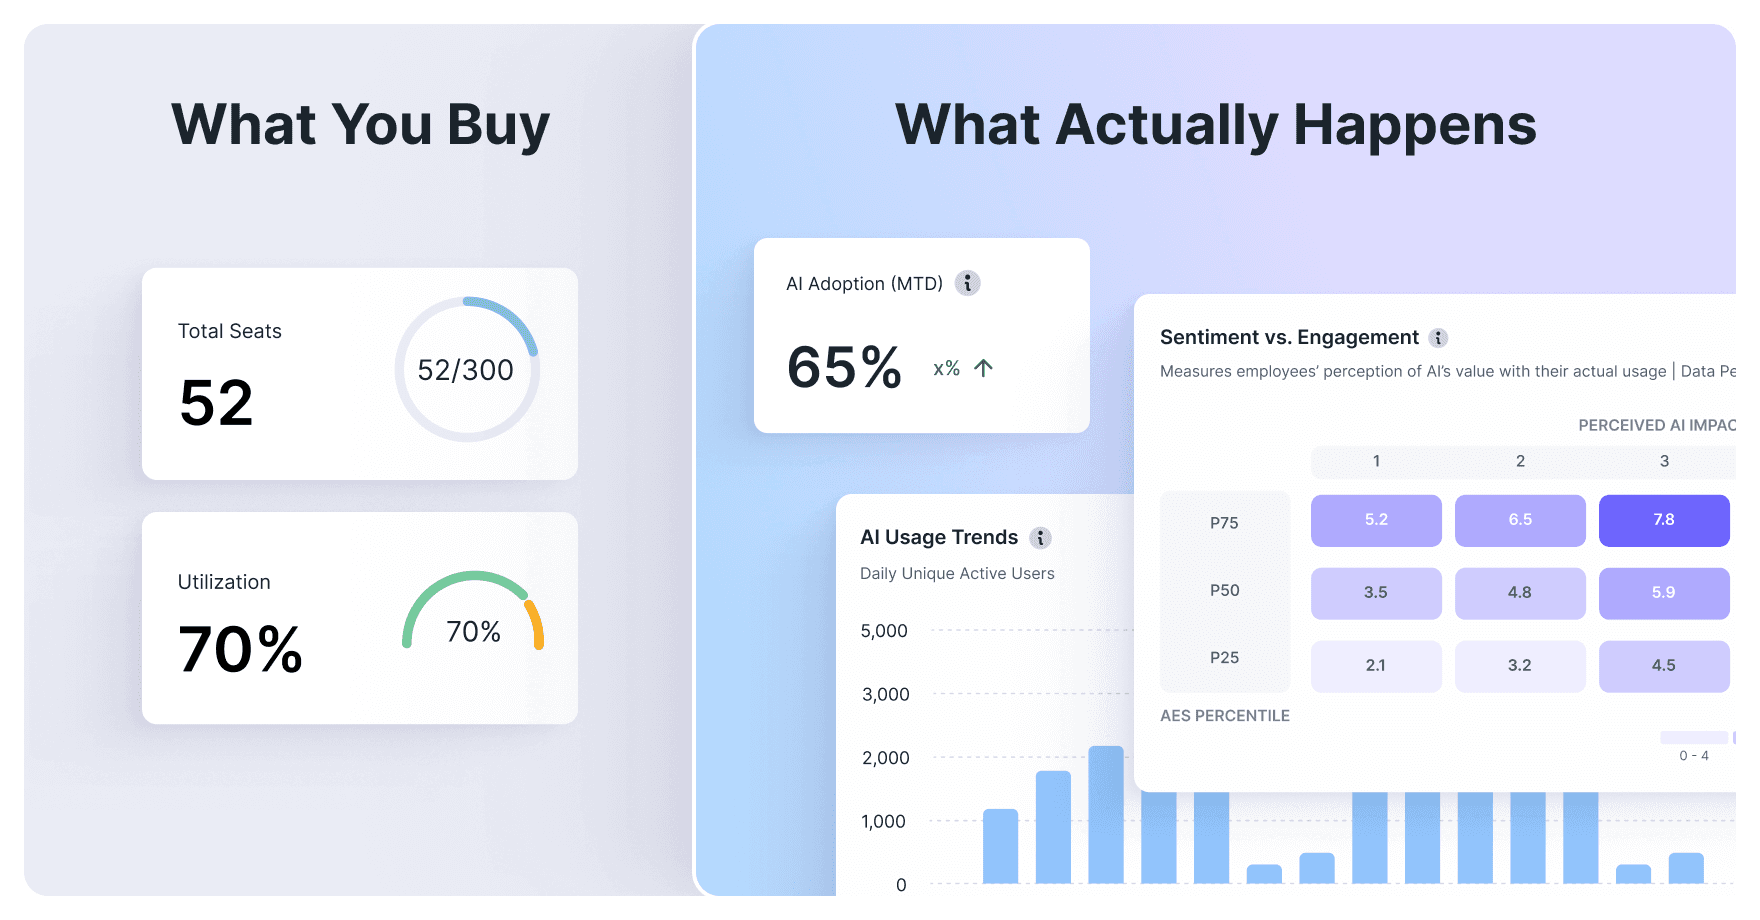
License metrics only show the number of seats purchased. Usage data reveals actual adoption rates, usage frequency, proficiency development, and business outcomes.
Consider a typical scenario: A company pays for 1,000 AI seats, but usage data shows there are only 287 monthly active users. The CFO approved $500,000 in annual licensing. The actual cost per active user is $1,742, not the $500 quoted cost per seat. That's not an accounting error. It's a measurement gap.
What CFOs Miss Without Usage Data
CFOs need answers that license counts can't provide.
True cost per active user, not cost per seat. When 40-60% of provisioned licenses are not used, the real cost structure remains hidden. Usage data reveals actual investment efficiency.
Department-level adoption patterns. Which teams justify increased AI investment versus which need enablement support? License counts show seats allocated. Usage data shows business value delivered.
Tool overlap and redundancy spending. The Larridin State of Enterprise AI 2025 report found that organizations typically discover $500K-$2M in annual license waste through usage analysis. This often happens because multiple team purchases overlap. Visibility from usage data could prevent redundant spending.
Shadow AI creating unbudgeted costs. According to the McKinsey State of AI in 2025 report, 83% of organizations say that employees install AI tools faster than security teams can track. These costs are outside approved budgets, so they are invisible until discovered.
ROI calculation connects usage, proficiency, and business impact. According to the Larridin State of Enterprise AI 2025 report, 81% of leaders say AI investments are difficult to quantify, and 79% say that untracked AI budgets are becoming a growing concern. Without usage data, ROI calculation is impossible.
What CIOs Need From Usage Analytics
CIOs need to make infrastructure and governance decisions that license metrics can't inform.
Which tools employees actually adopt versus ignore. Procurement decisions need usage intelligence, not vendor promises. Real adoption patterns show what works.
How employees are using various AI solutions, including AI agents. As organizations deploy autonomous AI agents to handle complex workflows, understanding their utilization becomes critical. The McKinsey State of AI in 2025 report shows that 23% of organizations are scaling agentic AI systems, but most lack visibility into agent performance and business impact.
Integration gaps blocking adoption. Low usage often indicates UX problems, not lack of value. Usage data distinguishes infrastructure barriers from enablement needs.
Training effectiveness and proficiency development. Which teams become more productive versus which need additional support? Usage patterns reveal proficiency progression.
Infrastructure planning based on real demand patterns. Capacity planning requires actual usage intelligence, not estimated demand. Real-time data prevents both over-provisioning waste and performance bottlenecks.
What AI Usage Data Actually Measures
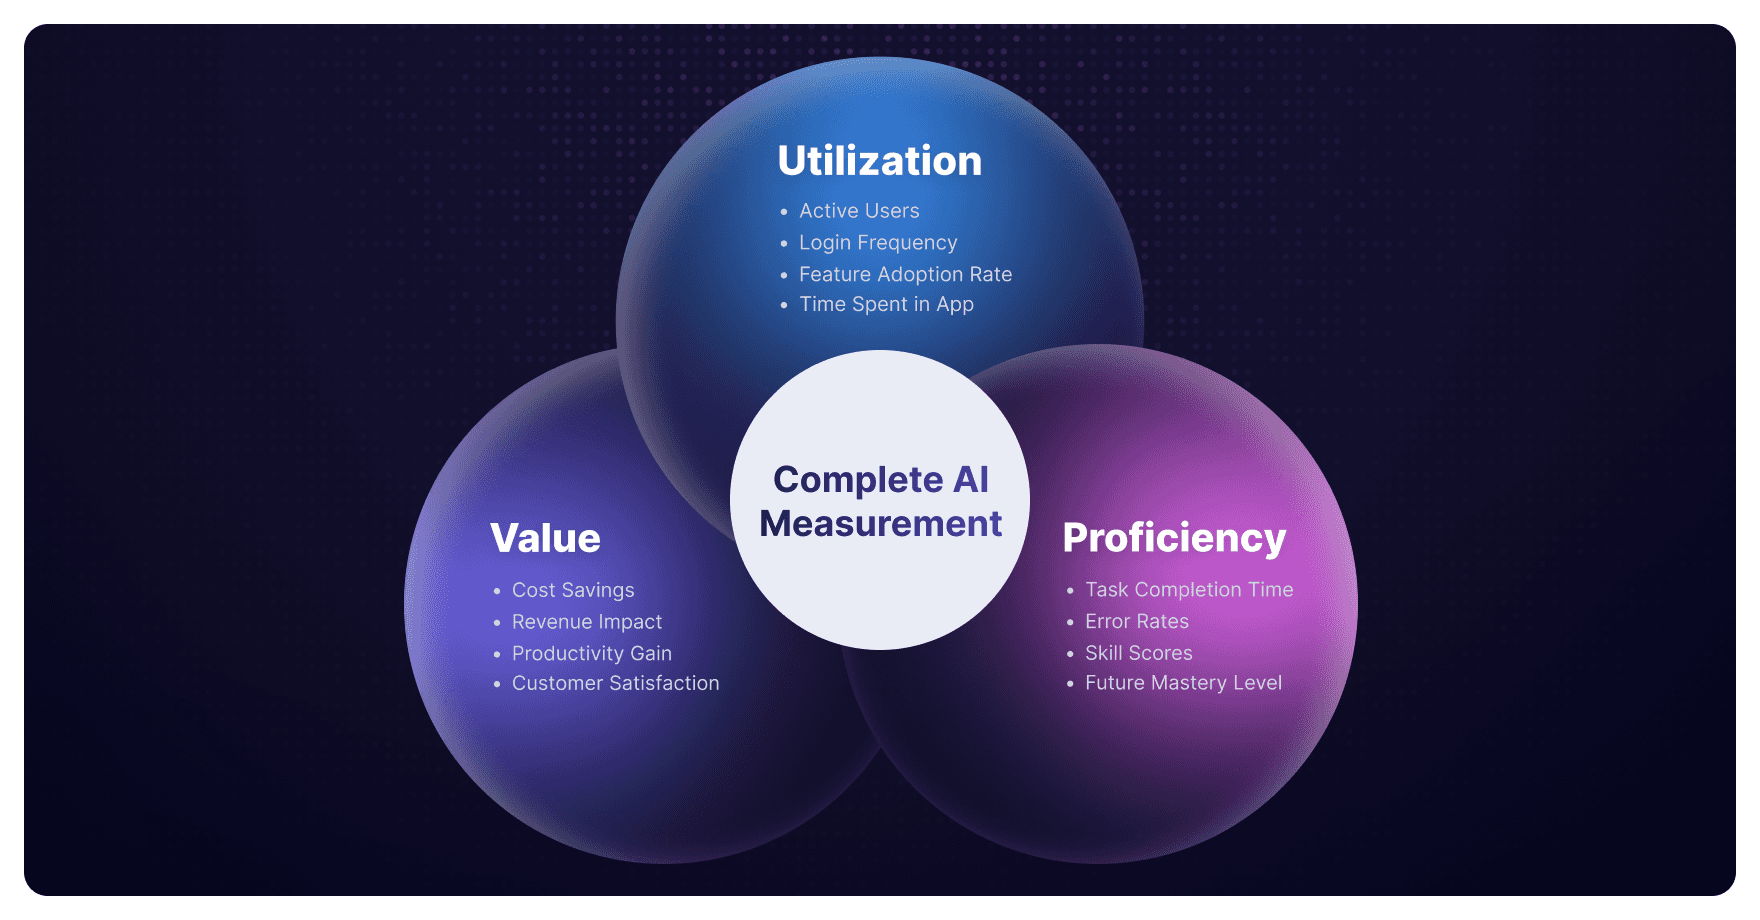
Larridin's framework centers on three dimensions: Utilization × Proficiency × Value. Organizations need all three to accurately measure AI performance.
Usage data shows who's using what. Proficiency data shows how effectively they're using it. Value data shows what business impact it delivers. You need complete measurement for confident decision-making.
Utilization Metrics: Who's Using AI
Daily Active Users (DAU) and Monthly Active Users (MAU). Core adoption indicators that show actual engagement versus provisioned capacity.
Session frequency, duration, and consistency. Sporadic usage indicates different adoption barriers than consistent low-duration sessions. Patterns reveal where to focus enablement efforts.
Tool-specific adoption rates by department. Finance needs different capabilities than marketing. Department-level measurement reveals where AI delivers value and where it stalls.
Use case specific adoption rates by department. Track which workflows and AI agents are being used, not just which tools. As organizations scale agentic AI systems, measurement must capture usage across functions, from IT service desk automation to knowledge management research agents.
Time-series trends showing adoption acceleration or stagnation. Is AI adoption growing, plateauing, or declining? Trend analysis can inform future infrastructure needs and identify interventions.
Proficiency Metrics: How Effectively Teams Use AI
Advanced feature adoption rates. Are users sticking to basic capabilities or leveraging advanced functionality? Proficiency correlates with value realization.
Prompt sophistication and iteration patterns. Expert users craft nuanced prompts and iterate strategically. Beginners struggle with prompt engineering. Usage data reveals proficiency distribution, identifying both 10x users to learn from and beginners that need support.
Cross-tool workflow integration. Sophisticated users integrate AI across their workflow. Usage patterns reveal whether employees use AI as isolated tools or integrate their capabilities.
Time to productivity for new users. How quickly do new employees become productive using AI? Rapid proficiency development indicates effective enablement. Slow progression reveals training gaps.
Expert versus beginner usage patterns. There are power users in every organization. Usage data identifies them and reveals what they do differently. These patterns become the foundation for organization-wide scaling.
Value Metrics: Connecting Usage to Business Outcomes
Task completion rates and time savings. Productivity gains require measuring both usage frequency and task outcomes. Value measurement connects AI activity to work completed.
Workflow automation impact, including AI agents. As organizations deploy autonomous agents, measurement must capture automated workflow completion rates, agent accuracy, and human-in-the-loop intervention requirements. The McKinsey State of AI in 2025 report shows that organizations scaling AI agents are seeing the strongest cost benefits in software engineering, manufacturing, and IT functions.
Business outcome correlation. The critical connection: Does increased AI usage correlate with revenue growth, cost reduction, or other KPIs? Value measurement ties AI investment to business strategy.
Cost efficiency per productive session. Not all usage creates equal value. Efficiency measurement reveals which AI applications deliver ROI and which consume resources without measurable impact.

How to Collect and Analyze AI Usage Data
Collection Methods: Comprehensive Coverage
Browser-based tracking provides comprehensive SaaS AI coverage. Deploy once to discover all AI tools accessed across your organization; sanctioned and shadow. Browser-level monitoring captures every AI application without requiring individual integrations.
API-level monitoring for integrated platforms. Deep analytics require API access. Platform-specific monitoring provides detailed usage intelligence for critical systems.
Network analysis for shadow AI discovery where possible. Some organizations use network-level monitoring to discover untracked AI applications. Effectiveness varies based on infrastructure architecture.
Platform-native analytics offer limited scope. Individual AI platforms provide usage data, but only for their tool. Enterprise-wide visibility requires comprehensive monitoring beyond vendor-specific analytics.
What Complete Usage Data Captures
Tool inventory at all times. Approve enterprise tools and shadow AI for every AI application across the organization. Complete visibility is the foundation for informed governance.
Identifying and tracking AI agents. As organizations deploy autonomous agents, measurement must capture what agents do, output quality, and business impact. Agent-specific analytics are essential for scaling agentic AI systems effectively.
User patterns showing which teams access which tools, when, and how frequently. Department-level and role-specific insights reveal adoption leaders and laggards.
Session analytics including duration, feature utilization, and workflow patterns. Detailed session data distinguishes productive usage from experimental access.
Cross-tool behaviors showing how AI tools work together, including through AI agents. Modern workflows integrate multiple AI capabilities. Usage data reveals integration patterns and identifies optimization opportunities.
Compliance indicators from usage patterns. Certain usage patterns trigger policy review, such as large data exports, unusual access times, or integration with unapproved systems. Real-time monitoring enables proactive governance.
Key Analytics to Track
Adoption Analytics
Adoption Analytics reveal organizational AI maturity:
Overall adoption rate and tool-specific adoption. What percentage of employees actively use AI? Which specific tools are adopted and which are not used?
Department comparison showing leaders and laggards. If marketing has a 78% adoption rate, but finance is at 23%, usage data can show where to replicate success and where to provide support.
Adoption velocity and barriers. Is adoption accelerating or stalling? What prevents higher utilization? Velocity measurement informs strategy.
Engagement Analytics
Engagement Analytics measure usage consistency:
DAU/MAU ratio indicating usage consistency. High ratios indicate embedded AI usage. Low ratios suggest sporadic adoption requiring enablement intervention.
Session frequency and duration by role. Different roles require different usage patterns. Sales teams need frequent short sessions. Analysts need sustained deep work. Role-specific measurement reveals whether AI fits natural workflows.
Power user identification. Every organization has 10x AI users. Usage data identifies them and reveals both what they accomplish and how they accomplish it. These patterns scale across the enterprise.
Value Analytics
Value Analytics connect usage to outcomes:
Usage correlation with business outcomes. Does increased AI adoption correlate with revenue growth, cost reduction, or productivity gains? Value analytics answer the CFO's fundamental question: What's our ROI?
Cost per active user versus cost per seat. True investment efficiency is when you measure actual usage, not capacity.
Productivity gains and ROI by tool and department. Which AI investments deliver measurable value? Which consume resources without impact? Department-level ROI analysis guides investment strategy.
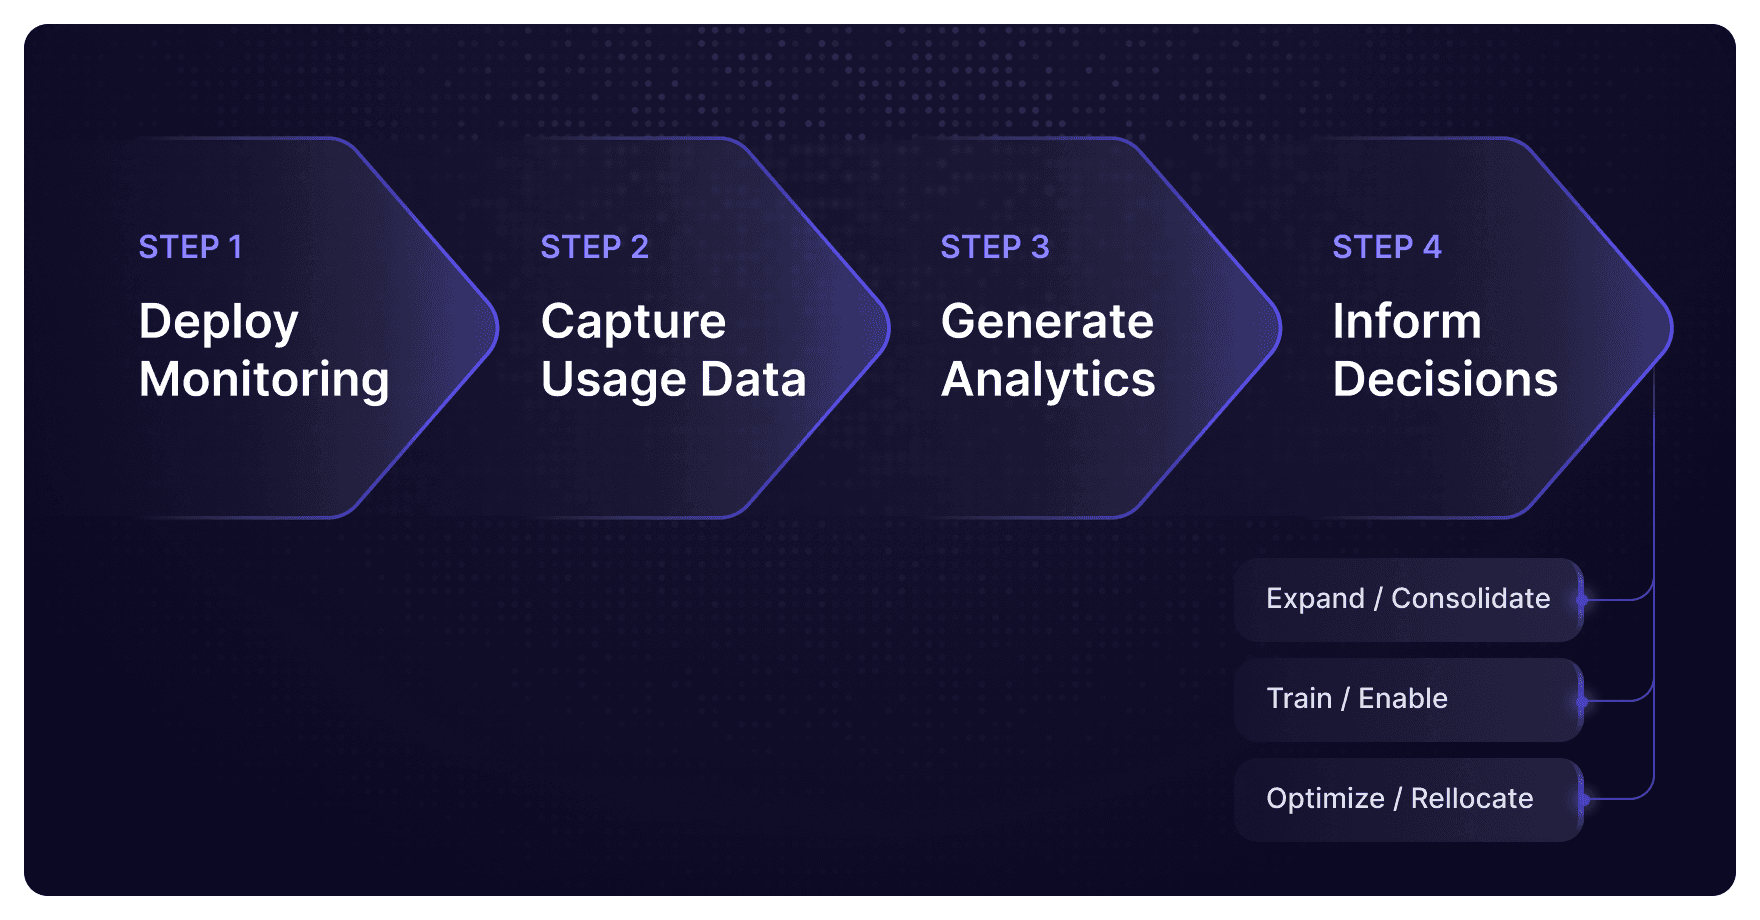
Turning Data Into Decisions
Measurement enables confident decision-making:
When to expand or consolidate tools. High-adoption tools with strong proficiency development and measurable value justify expansion. Low-adoption tools with weak proficiency and unclear value require consolidation.
Where to invest in training. Department-level proficiency gaps reveal training needs. Power user patterns inform training content.
How to optimize licensing budgets. The Larridin State of Enterprise AI 2025 report found that enterprises typically discover $500K-$2M in annual license waste through usage analysis. Optimization starts with measurement.
Which departments need additional enablement support. Low utilization doesn't always mean low value. Often it reveals enablement gaps. Usage data distinguishes need for training from need for different tools.
Overcoming AI Usage Data Challenges
The Shadow AI Problem
According to the Larridin State of Enterprise AI 2025 report, 84% of organizations discover more AI tools than expected during audits. That gap represents shadow AI, or applications employees use outside of approved systems.
Untracked usage creates compliance, cost, and security risks. Sensitive data flows to unknown platforms. Costs accumulate outside budgets. Governance operates blind.
Comprehensive monitoring reveals which tools employees use outside of approved systems. Discovery isn't surveillance, it's visibility for informed governance.
Usage data enables informed decisions: approve useful tools and provide secure alternatives for problematic ones. Blanket restrictions fail. Smart governance starts with complete visibility.
Privacy and Compliance: Ethical Collection
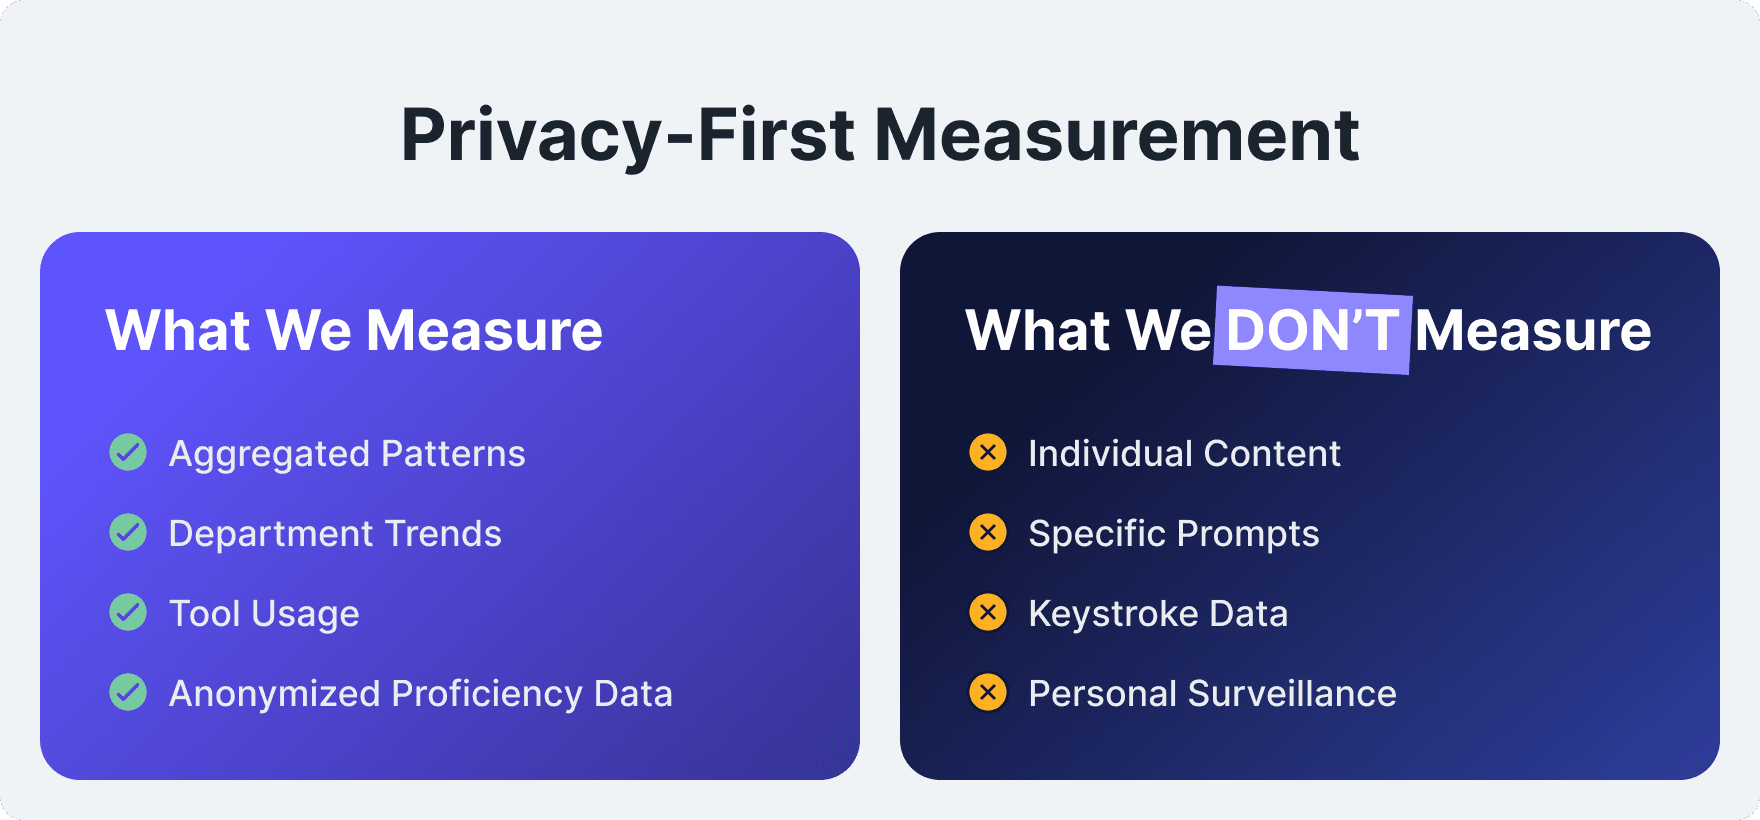
Focus on aggregated patterns and anonymized metrics, not individual surveillance. Ethical AI usage measurement respects privacy, while providing strategic intelligence.
What ethical collection includes: Tool access patterns, usage frequency, general workflow patterns, department-level proficiency, and business outcome correlations.
What crosses boundaries: Content monitoring, keystroke logging, individual prompt surveillance, and individual performance scoring.
Transparency builds trust. Employees need to know that the focus is optimization, so they don’t feel like they’re being watched. Clear communication about what's measured and why maintains trust.
Data Accuracy Considerations
Tracking across devices, browsers, and remote scenarios requires comprehensive deployment. Hybrid work environments make measuring more complicated.
Mobile and desktop application monitoring. AI usage spans devices. Complete measurement requires multi-platform coverage.
Handling VPN and distributed work environments. Remote work creates infrastructure complexity. Accurate measurement adapts to modern work patterns.
Interpretation Challenges: Context Matters
High usage doesn't automatically mean high value. Frequent access might indicate poor UX requiring repeated attempts, not high value delivery.
Low usage might indicate UX problems, not lack of need. Adoption barriers range from poor integration to inadequate training. Usage patterns require context for accurate interpretation.
Department differences require context-specific benchmarks. Engineering teams show different AI usage patterns than customer service teams. Both can achieve high value with very different utilization profiles.
Connect usage to outcomes for complete intelligence. Utilization and proficiency metrics matter, but only when connected to business value. Complete measurement requires all three dimensions.

Implementing Your AI Usage Data Strategy
Step 1: Define Measurement Priorities
Different executives need different insights.
CFO needs: Strategic AI investment planning that drives measurable business value, ROI frameworks that connect spending to tangible outcomes and competitive advantage, and financial insights that optimize resource allocation for maximum organizational impact.
CIO needs: Tool rationalization to eliminate redundant systems, adoption rates to show which tools employees actually use, real demand patterns for infrastructure planning, and shadow AI visibility for security risk management.
CAIO needs: Proficiency development that shows skill progression across the organization and identification of power users to replicate their approaches enterprise-wide and scale best practices.
Step 2: Choose Your Approach
Browser-based monitoring for comprehensive coverage. Deploy once to discover everything. Comprehensive visibility across all AI tools, both sanctioned and shadow.
Platform-specific analytics for depth. Deep integration with critical AI systems provides detailed usage intelligence beyond browser-level monitoring.
Specialized AI usage platforms like Larridin Scout for complete intelligence. Purpose-built solutions provide the Utilization × Proficiency × Value framework out of the box. Scout’s browser-based monitoring and desktop agents discover your entire AI landscape—including shadow AI—in 30 days, measuring what your AI investments actually deliver across your organization.
Step 3: Deploy and Validate
Start with pilot programs. Test measurement approach with specific departments or use cases before enterprise-wide deployment.
Validate data quality and privacy compliance. Ensure accurate capture, ethical collection, and regulatory compliance before scaling.
Refine based on findings. Initial deployment reveals gaps and opportunities. Iterate rapidly.
Step 4: Create Reporting Cadence
Executive dashboards for leadership. CFOs and CIOs need strategic insights: high-level adoption trends, cost efficiency metrics, ROI calculations, and competitive benchmarking.
Department reports for managers. Operational leaders need tactical intelligence: team-specific adoption patterns, proficiency development, and value correlation specific to their function.
Trend analysis for strategic planning. Long-term patterns inform infrastructure investment, training priorities, and governance strategy.
Quarterly reviews tied to business outcomes. Regular cadence ensures AI measurement informs strategic decisions. Tie AI metrics to business KPIs in formal reviews.
Real Results
Organizations that do comprehensive AI usage measurement typically see transformation within the first year. License optimization alone often recovers 30-50% of wasted spend. Adoption acceleration improves utilization across previously underperforming departments. Strategic investment guided by actual usage analytics rather than vendor promises or executive intuition delivers measurable competitive advantage.
The intangible benefit often matters more than direct savings: confident decision-making about the largest workforce investment in business history. 85% of leaders believe they have less than 18 months before falling behind permanently according to the Larridin State of Enterprise AI 2025 report. Measurement-driven strategy is the difference between AI chaos and competitive advantage.
Frequently Asked Questions
What's the difference between AI license tracking and AI usage data?
License tracking counts seats purchased and measures input costs. AI usage data measures actual adoption: who uses which tools, how frequently, how effectively, and what business value they deliver.
Most enterprises track licenses, but have zero visibility into usage. This makes ROI calculation impossible. You can't improve what you don't measure. License counts tell you what you bought. Usage data tells you what you got.
How much does unused AI capacity typically cost enterprises?
The Larridin State of Enterprise AI 2025 report found enterprises with 1,000+ employees typically find $500K-$2M in annual license waste through usage data analysis.
The larger cost is opportunity cost; paying for seats delivering zero value instead of investing in tools employees actually adopt and capabilities that drive business outcomes.
Can AI usage data be collected without violating employee privacy?
Yes, through privacy-first principles. Effective usage data focuses on aggregated patterns, tool-level analytics, and anonymized metrics, not keystroke logging or content surveillance.
Employees should understand what's measured: which tools are accessed, usage frequency, and general workflow patterns. What isn't measured: specific prompts, personal content, or individual scoring.
Transparency and privacy aren't opposing goals. Clear communication about measurement purpose—optimization, not surveillance—maintains trust, while enabling strategic visibility. Organizations that do ethical AI usage measurement see stronger adoption because employees understand the benefit: better tools, better training, and strategic investment guided by actual needs.
What AI usage metrics matter most to CFOs and CIOs?
Three critical metrics transform AI from unaccountable expense to measurable investment:
Utilization rate shows the percentage of paid licenses actively used. This uncovers cost waste immediately. When 40-60% of seats go unused, optimization opportunities are clear.
Cost per active user reveals true investment efficiency beyond seat pricing. This transforms cost analysis from theoretical rates to actual efficiency.
Usage correlation with business outcomes connects AI spending to revenue, productivity, or KPIs. This answers the fundamental question: What business value do our AI investments deliver?
These three metrics enable confident decision-making. CFOs can justify AI investment to boards. CIOs can demonstrate technology strategy effectiveness. CAIOs can prove transformation progress.
How quickly can organizations start collecting AI usage data?
Browser-based usage monitoring deploys in days. Comprehensive AI tool discovery typically completes within 30 days. Most enterprises see initial usage intelligence within one week and strategic insights within one month.
The key is to start immediately. Every day without usage data is another day of blind AI investment. According to the Larridin State of Enterprise AI 2025 report, 85% of leaders believe they have less than 18 months before falling behind permanently. Measurement delays create a competitive disadvantage.
Larridin Scout provides complete AI usage analytics within 1 day of deployment. The platform discovers every AI tool in your organization, both sanctioned and shadow, then measures utilization, proficiency, and business value using the complete Utilization × Proficiency × Value framework.
How does AI usage data help identify shadow AI?
Comprehensive monitoring reveals every AI tool accessed across the organization, not just approved platforms. According to the Larridin State of Enterprise AI 2025 report, 84% of organizations discover more AI tools than expected during audits. That discovery gap represents shadow AI.
Usage data shows which tools employees use outside of sanctioned systems, usage frequency, and purposes. This visibility enables informed governance rather than blanket restrictions.
The goal isn't to restrict AI usage; it's to enable effective AI adoption. Shadow AI often emerges because approved tools don't meet actual needs. Usage data reveals what employees need, so CIOs can provide secure alternatives rather than enforce futile restrictions.
Smart governance starts with complete visibility. Shadow AI discovery through usage data transforms governance from reactive crisis management to proactive strategic enablement.
What's the ROI of implementing AI usage data analytics?
Direct financial impact typically delivers strong returns in year one:
License optimization eliminates wasted spend. Organizations typically recover $500K-$2M annually through usage-driven optimization.
Adoption acceleration improves utilization. When employees get the right tools with the right training at the right time, productivity gains compound quickly.
Strategic investment based on actual patterns rather than vendor promises. CFOs make confident AI investment decisions backed by data, not intuition.
But the intangible benefit often matters more: confident decision-making about the largest workforce investment in history. According to the Larridin State of Enterprise AI 2025 report, enterprise AI spending will reach $644 billion in 2025 with 72% of investments destroying value through waste.
Measurement transforms AI from faith-based investment to data-driven competitive advantage. That strategic capability—knowing what works, why it works, and how to scale it—creates competitive differentiation that compounds over time.
You can't manage what you don't measure. Organizations that implement comprehensive AI usage measurement create the foundation for everything else: governance, adoption strategy, ROI calculation, and ultimately competitive advantage through AI.
About Larridin
Larridin is the AI ROI measurement platform for enterprise AI transformation. Scout, a centrally deployed browser plugin and desktop application, detects every AI tool and agent across your organization—revealing adoption patterns, benchmarking proficiency by team and location, and correlating usage with productivity.
Like Nielsen for TV or comScore for the internet, Larridin provides the objective intelligence leaders need to navigate the $644 billion AI market explosion with confidence.We measure AI utilization, proficiency, and business value across your entire enterprise, so you can turn AI chaos into competitive advantage.
Learn more about Scout.